
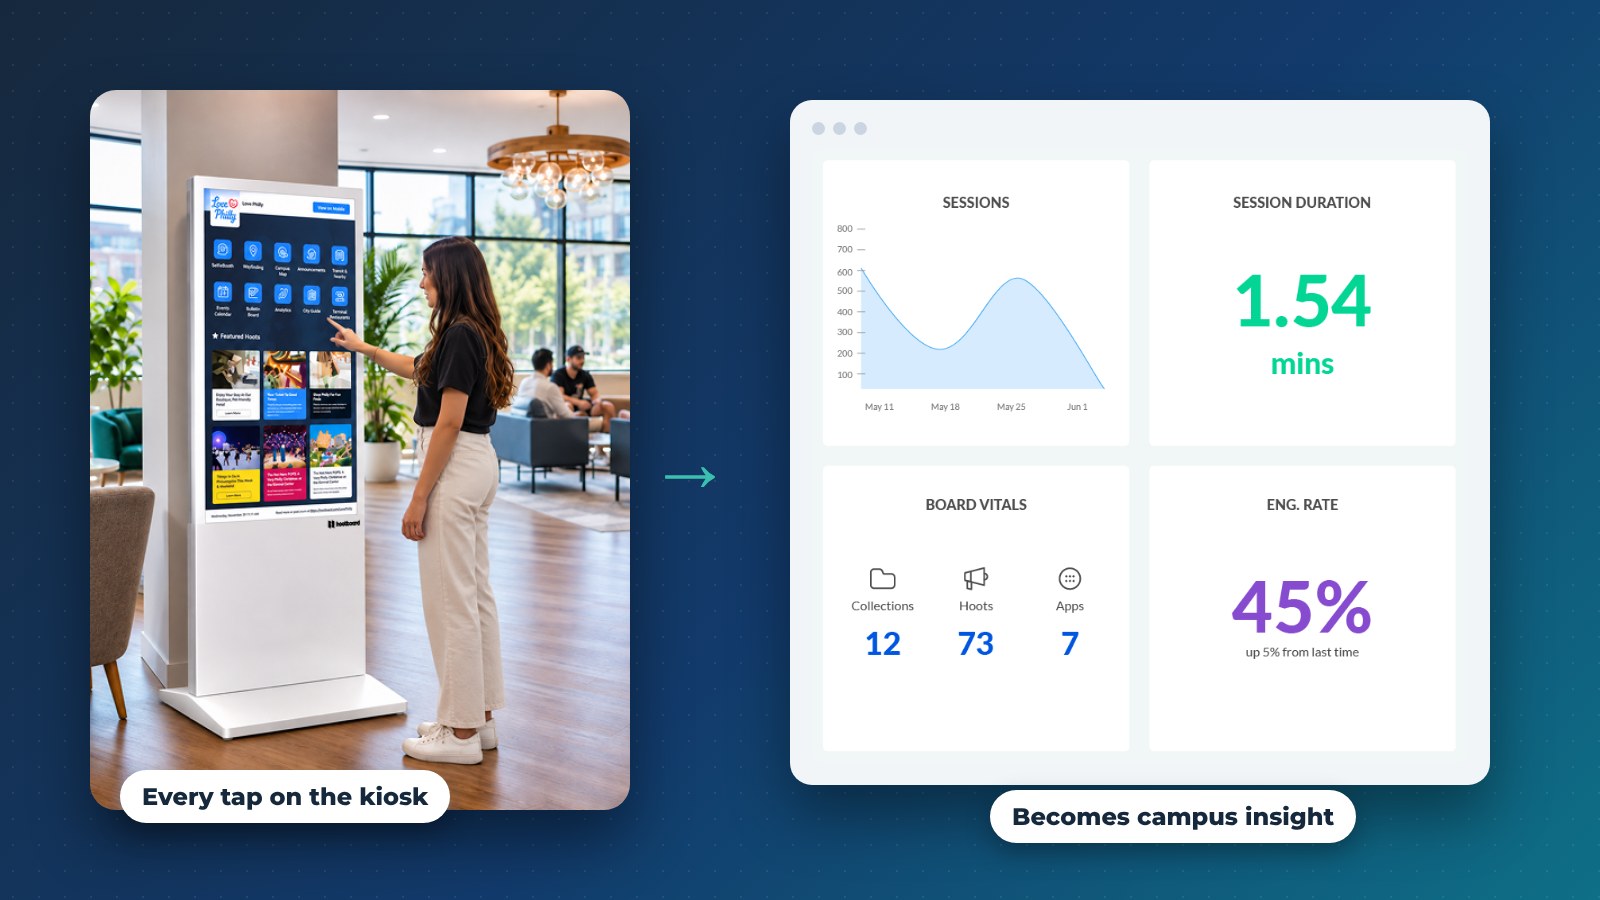
Digital kiosks on campus do more than show a map. Every tap is a small signal about student engagement: what students look for, when, and where. Most universities collect plenty of data, but very little of it arrives in time to change anything.
Annual surveys come back after the semester that caused the complaints. Focus groups tell you what a handful of students remember. Meanwhile the screens students touch every day, the campus map kiosk in the student union, the events board in the library, the signage in the residence hall lobby, keep a steady record of what students actually do.
That record is aggregated and anonymous. Nobody logs in to use a kiosk. But it is specific enough to show which services students look for before exams, which kiosks are busy at which hours, and which events get looked at.
This article covers what a campus kiosk network tells a university, how student affairs, IT and campus analysts can act on it, and how to do that responsibly. We use HootBoard for campuses as the example, so the details are concrete.
Why campus engagement data matters now
Colleges are being asked to raise satisfaction and retention with flat budgets and small teams. Traditional feedback is useful, but it is slow.
Engagement data from kiosks and screens is different:
- Current. You see this week's searches this week.
- Behavioral. It shows what students did, not what they say they would do.
- Continuous. It is a feedback loop, not a once-a-year snapshot.
A university that reads this data can spot a problem during orientation week and fix the signage, the content or the staffing before the second week starts.
What a campus kiosk network tells you
HootBoard reports usage for every screen and for the network as a whole. Here is what that covers.

Interaction data from campus kiosks
- Sessions and dwell time per screen. Which kiosks get used, when, and for how long. The library kiosk may be busiest in the evening, the admissions lobby on tour days.
- Apps opened. Campus Map, Events, Dining, Directory, Shuttle, Help Desk. This shows what students come to the screen for.
- Top searches. The offices, buildings and services students look for most.
- Heatmaps. Where on the screen people tap, which tells you whether the layout matches what they want.
- QR scans. How often students sent a route, an event or a post to their phone. A scan usually means the kiosk did its job.
- Visitor origin and group. For admissions tours and campus events, where visitors come from and who they came with.
Read more about campus wayfinding kiosks and how the map works on the screen.
Engagement data from signage and posts
The same dashboard reports content analytics for hoots (posts) and the apps on each board:
- Which announcements, events and deals get opened
- Which categories do best: academic, career, wellness, clubs
- How interest shifts across the semester
Together, these two views show what students care about and when.
See the campus analytics dashboard in a demo
How student affairs teams use it
Student affairs owns housing, wellness, activities and support. These are the areas where timely information changes outcomes.
Spotting bottlenecks before they grow
Repeated searches for the same office, or a sudden jump in kiosk use at one building, usually point to confusion or unmet demand. With that in view, a team can:
- Adjust front-desk staffing at peak hours
- Fix a building name or office location on the map
- Add a post or a playlist slide that answers the question students keep asking
The team acts before the complaints arrive.

Designing services around behavior
What students do often differs from what staff expect:
- Wellness searches may climb during midterms, not at orientation
- Career services searches may jump the week before internship deadlines
- Orientation content may need a second run three weeks into the semester
When services follow the data, they show up when students look for them.
The role of university IT
IT decides whether campus screens stay static or become a feedback loop.
Turning screens into one system
With a platform like HootBoard, IT gets:
- One cloud dashboard for every kiosk and screen on campus, with device status
- Content published once that shows on kiosks, signage and students' phones
- Integrations with campus calendars (Localist, The Events Calendar, iCal feeds), transit feeds (GTFS) and alert systems, plus 1000+ more through Zapier
- Priority-override alerts across every screen for emergencies
IT moves from maintaining screens to running a campus communication layer, without building anything custom. The kiosk software overview covers how the platform is managed.
Privacy and trust
Kiosk analytics describe usage, not individuals. Good practice for any campus program:
- Report aggregated trends, not single sessions
- Collect optional visitor details only through clear, opt-in prompts
- Tell students plainly what the screens record and why
- Apply the same data rules the university uses for other student-facing systems
HootBoard kiosks do not need a student login, so the analytics start from anonymous usage.
How campus analysts turn insight into action
Kiosk data gets more useful next to the data a university already has.
Joining kiosk data with the rest of campus
- Top searches against the facilities directory: which names students use that the directory does not
- Event opens against your own attendance counts: which events get seen but skipped
- Per-screen traffic against building schedules: which spaces are underused
From dashboards to decisions
A good analytics view gives leadership three things: clear numbers per screen, trends over time, and a short list of actions. That is enough to justify moving a kiosk, rewriting a page or changing a service's hours.

Real-world uses
Orientation and first-year success
First-year students use campus kiosks the most. Watching the first month shows which buildings they search for, which onboarding content they open, and which help desk questions a kiosk could answer instead.
The result is students who find their own way sooner and a lighter help desk. See our post on solving the lost-freshman problem.
Participation in programs and events
Low attendance often means low visibility. Engagement data shows what students explore but do not act on, when a promotion should run, and which kiosk locations get the most attention.
How HootBoard fits
HootBoard combines interactive kiosks, digital signage and a content platform with analytics built in. On campus, that means:
- Campus Map with floor-by-floor indoor navigation, ADA routes and directions sent to the phone by QR code
- Events, Dining, Directory and Shuttle apps on the same screen
- Bulletin Board for student organizations, with one-click approval for staff
- Screen Playlists on idle screens, and emergency alerts that override everything
- One dashboard for content, screens and analytics, live in under 30 minutes without IT
Instead of adding one more system to maintain, it replaces the corkboard, the static map and the signage player. You can compare plans on the HootBoard pricing page.
FAQ
What data do campus kiosks collect?
Aggregated usage: sessions and dwell time per screen, apps and posts opened, top searches, tap heatmaps and QR scans. No student login is needed.
How do digital kiosks improve student engagement on campus?
They put the map, events, dining, shuttle and announcements where students already are. Students can take any item to their phone, and staff can see what students look for so content stays useful.
Is campus kiosk data a privacy risk?
Not when it stays aggregated. Kiosks record usage, not identities. Any optional visitor details should be collected through clear opt-in prompts and handled like other student data.
Who on campus should own kiosk analytics?
Shared ownership works best. IT runs the platform, student affairs and communications act on the findings, and campus analysts join the data with other sources.
Student-centered campuses listen to their screens
The next generation of campuses will not be defined by how many screens they install. It will be defined by how well they listen to what students do on them. Kiosk data is one of the fastest, most honest feedback sources a university has.
If you want to see what your campus kiosks could tell you, we will walk you through the dashboard. Book a campus demo.