Better Insights with the new HootBoard Analytics
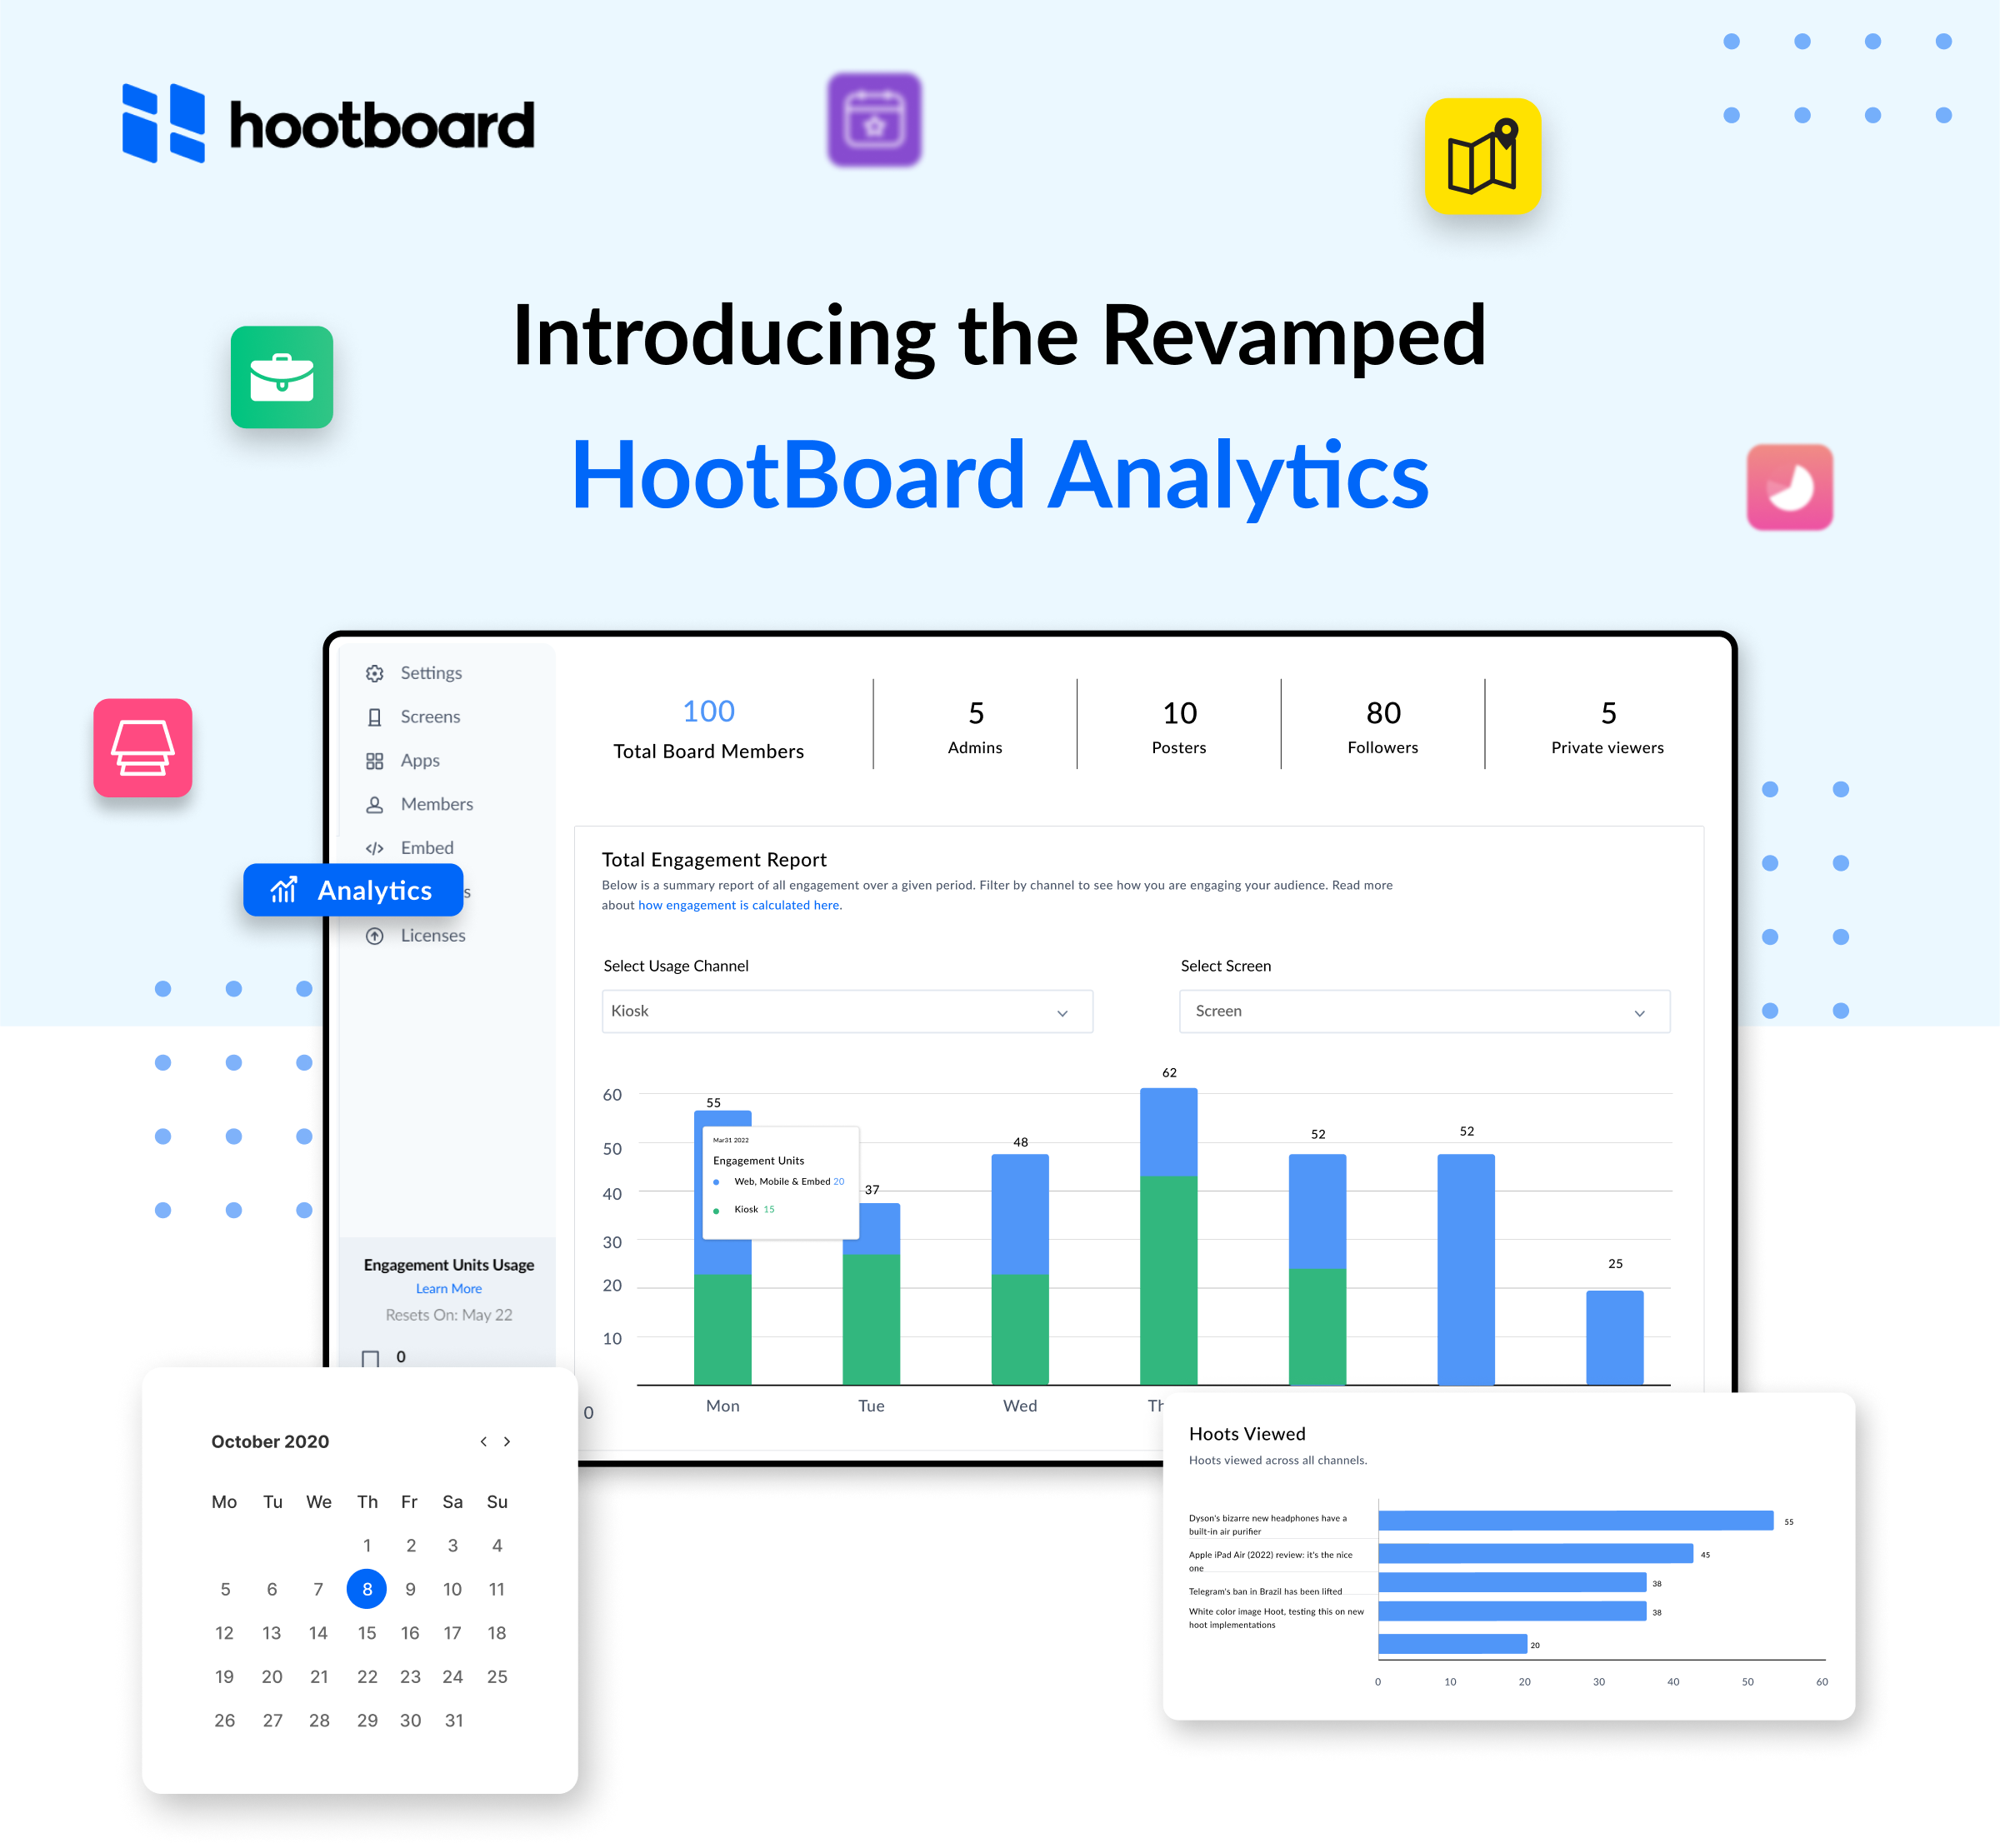
We have been on our wheels building a fresh and revamped interface for our HootBoard Analytics & oh boy! We are excited to announce its relaunch today. Tracking what is happening on your HootBoard over the multiple usage platforms has now gotten very easy. With the new HootBoard Analytics, you can now know the overall engagement on your board from all the communication channels. Here are some of the features that it provides.
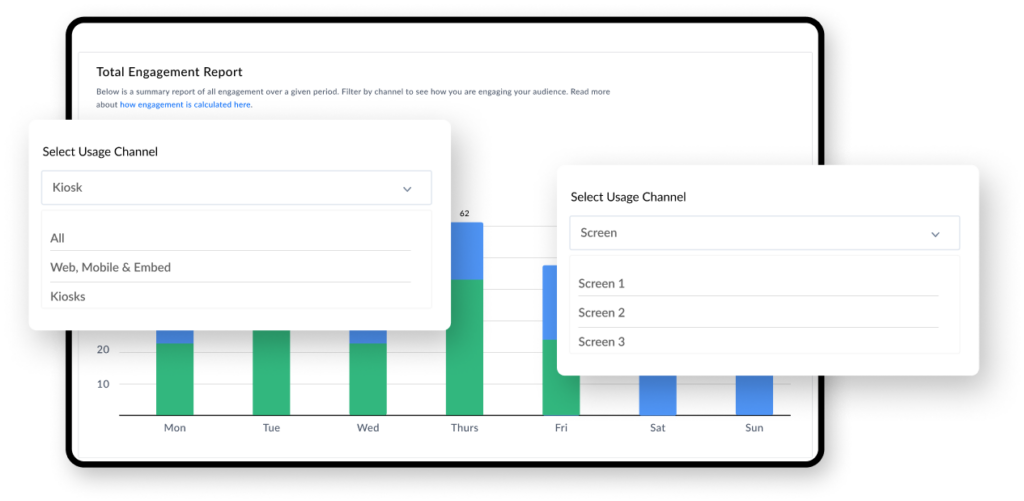 All Round Reports
You can now get reports from all the usage channels like web, mobile, embed & kiosks. Also, get a detailed breakdown of each screen by selecting the kiosk as the usage channel. With this, you see what is happening across all the platforms.
Better Performance Comparison.
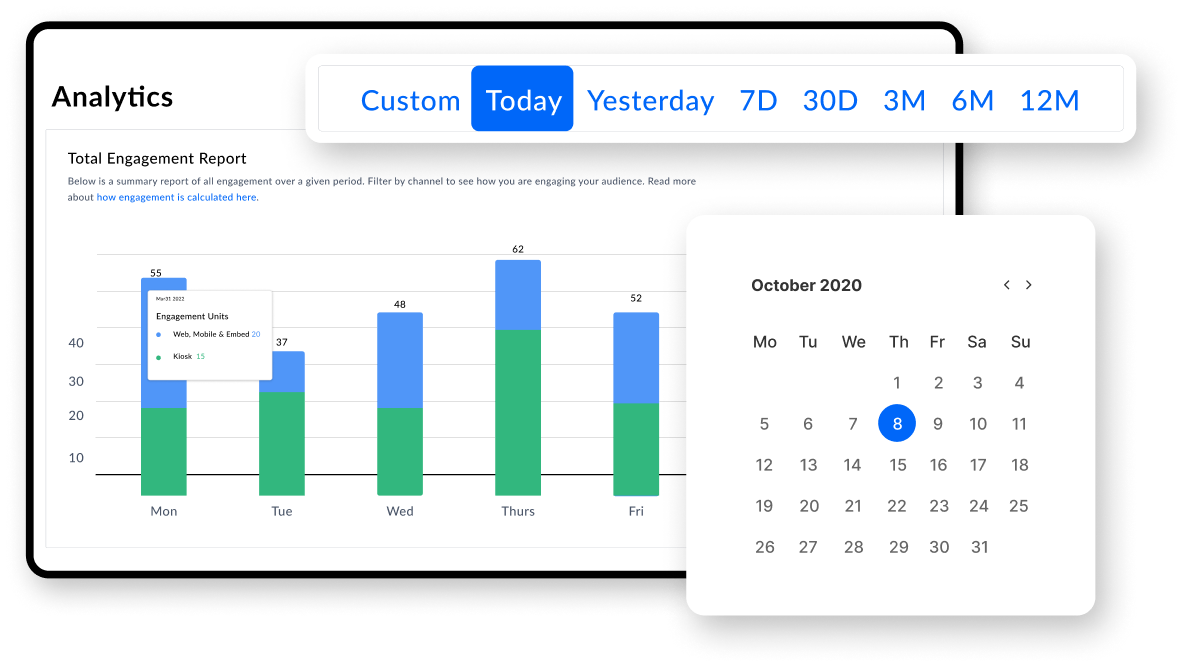
With our custom date feature, obtaining the required reports as you wish is made simple and easy. It will give you better insights for performance comparison. You can just input the date or time interval of the required reports we will generate them for you.
Hoot Insights
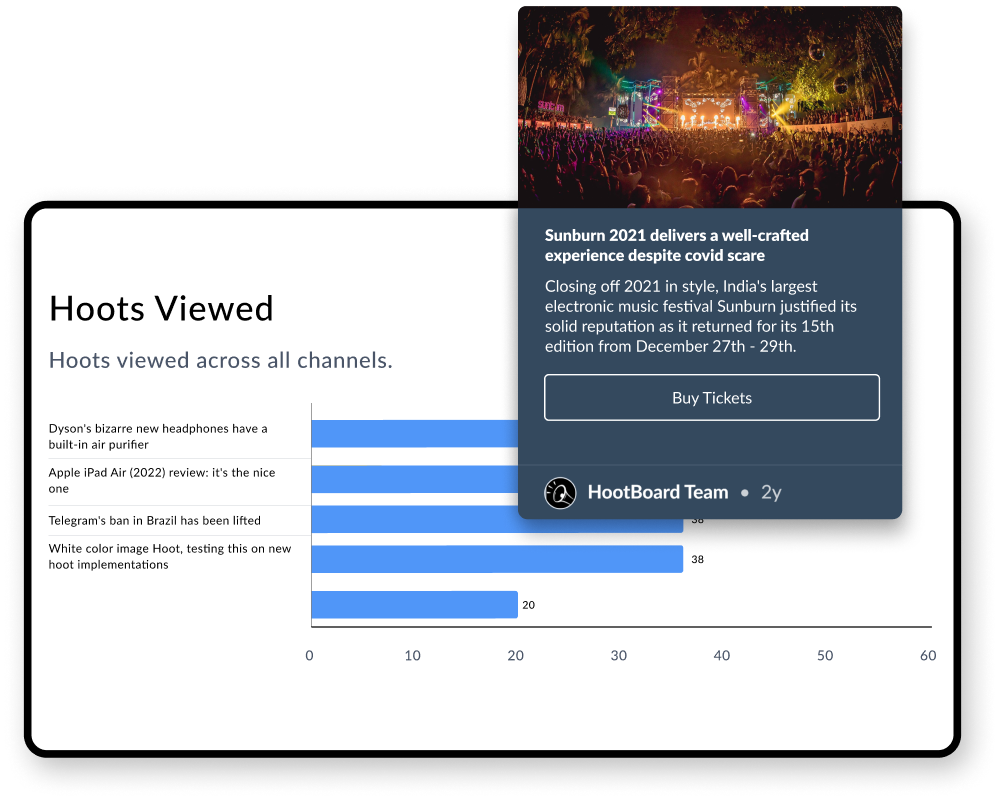
Your HootBoard is all about hoots, so knowing what kind of hoots your board users are engaging with helps you improve your board’s engagement. You can now get a detailed report of how they are performing. This report can help you understand what content attracts your board users. Once you know what they like posting hoots becomes easy!
App Performance
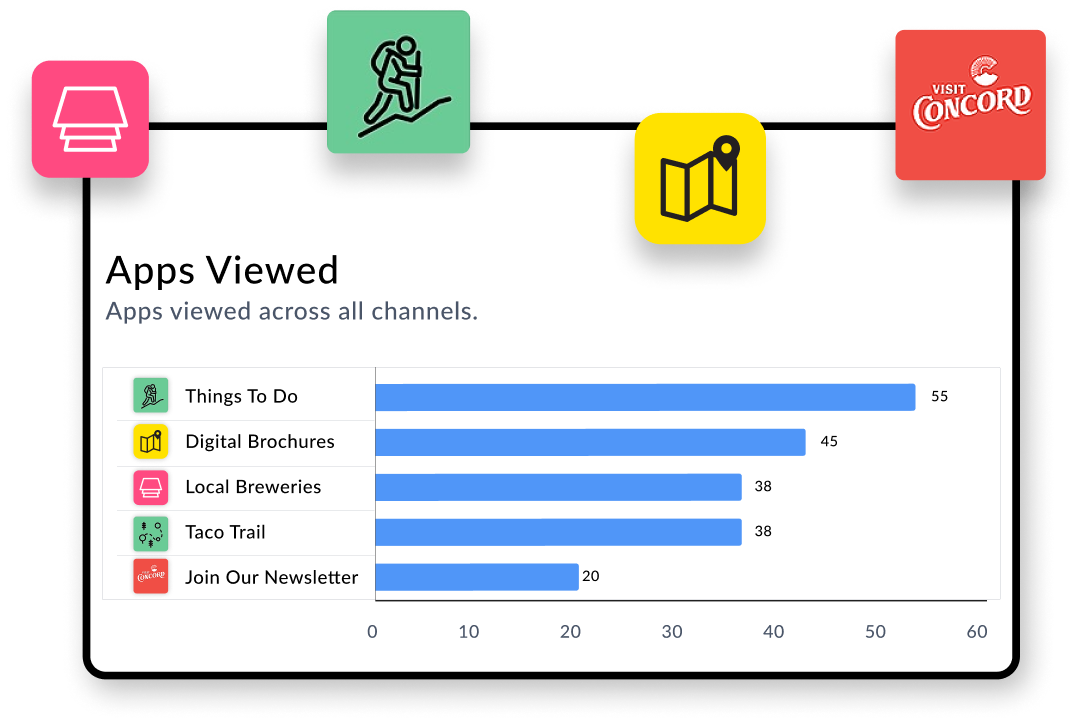
Apps on HootBoard are to add smart navigation to your board. With the App report, you know which apps on your board have the maximum interactions. This report can help you understand what type of content is engaging and attracts your users.
You can now try it and see how your board is performing. With the help of HootBoard Analytics, now create more traction and engagement for your board.
If you need further assistance, you can reach out to us at support@hootboard.com. We will be happy to help. 🙂

